
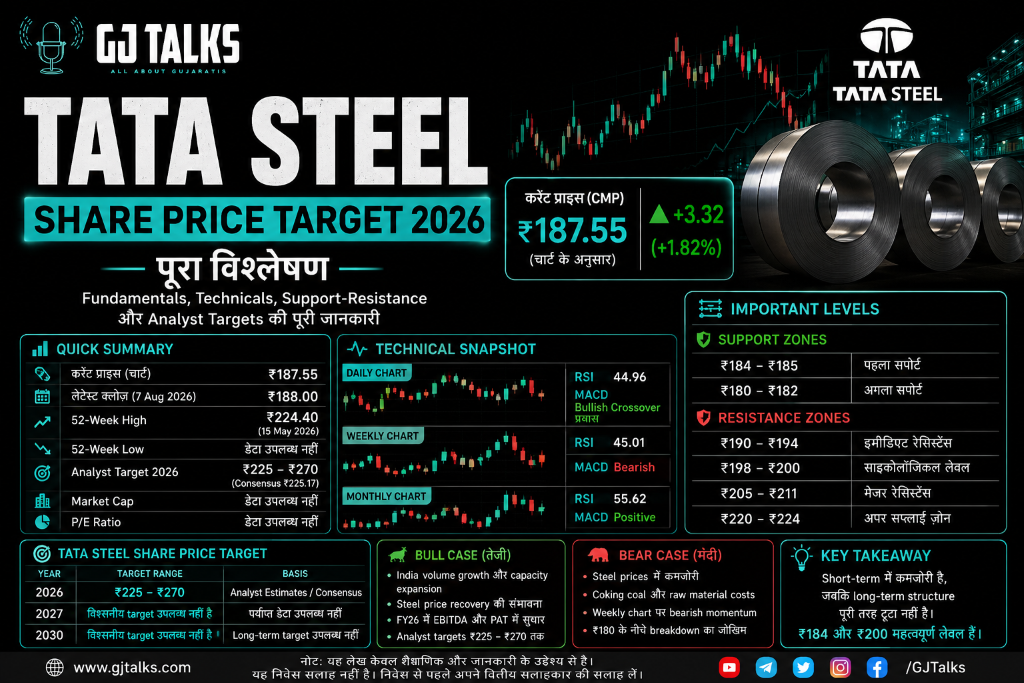
Quick answer for 2026 targets: Motilal Oswal’s 17 May 2026 SoTP target was ₹250. 25 June 2026 consensus sat at ₹225.17. Selected May 2026 reports ranged ₹229–₹270 (including ICICI Direct ₹270). These are analyst estimates, not GJTalks price predictions and not a buy or sell call.
Tata Steel के दिए गए daily, weekly और monthly charts में फिलहाल short-term weakness लेकिन long-term structure comparatively stronger दिखाई दे रहा है। Screenshot में price करीब ₹187.55 है, जबकि 7 August 2026 को बाजार बंद होने पर शेयर ₹188.00 पर था। Analyst estimates में भी काफी अंतर है। 25 June 2026 का consensus target ₹225.17 था, जबकि May 2026 की अलग-अलग brokerage reports में ₹229 से ₹270 तक targets दर्ज थे। इसलिए ₹225–₹270 को guarantee के बजाय analyst expectation zone के रूप में देखना बेहतर है।
क्विक समरी
| Item | Value |
|---|---|
| Chart Price | ₹187.55 — supplied chart |
| Latest verified close | ₹188.00 — 7 Aug 2026 |
| 52-Week High | ₹224.40 — 15 May 2026 |
| Analyst Target | ₹225.17 consensus; individual reports ₹229–₹270 |
| Daily RSI | 44.96 — supplied chart |
| Weekly RSI | 45.01 — supplied chart |
| Monthly RSI | 55.62 — supplied chart |
Latest verified market data के अनुसार Tata Steel 7 August को ₹188 पर बंद हुआ और उस समय अपने ₹224.40 के 52-week high से लगभग 16% नीचे था।
Tata Steel के बारे में
Tata Steel भारत की प्रमुख integrated steel companies में से एक है। कंपनी का business India के साथ Netherlands, UK और Thailand जैसे international markets तक फैला है।
Steel एक cyclical business है, इसलिए Tata Steel पर domestic steel prices, iron ore और coking coal costs, Chinese exports, infrastructure demand और European operations का असर पड़ सकता है।
शेयर अभी क्यों चर्चा में है
Tata Steel में इस समय दो contrasting themes दिखाई देती हैं—India business में expansion और volume growth, लेकिन दूसरी तरफ global steel prices और input costs को लेकर uncertainty।
कंपनी ने 8 July 2026 को बताया कि Q1 FY27 में Tata Steel India का crude steel production 5.82 million tonnes रहा, जो साल-दर-साल लगभग 11% अधिक था। India deliveries 5.17 million tonnes रहीं, जबकि पिछले साल इसी quarter में 4.75 million tonnes थीं।
इसके विपरीत, August में steel prices में कमजोरी, Chinese steel exports और coking-coal costs जैसे factors earnings outlook के लिए risks बने हुए थे।
यानी operational growth positive है, लेकिन commodity cycle को नजरअंदाज नहीं किया जा सकता।
Fundamental Analysis (फंडामेंटल विश्लेषण)
FY2025-26 में Tata Steel ने consolidated revenue ₹2,32,140 करोड़ और EBITDA ₹34,848 करोड़ report किया। EBITDA में साल-दर-साल 35% improvement हुई। Consolidated PAT ₹10,886 करोड़ रहा। ये figures Tata Steel की 15 May 2026 की official release से हैं।
India operations इस performance का महत्वपूर्ण हिस्सा रहे। FY26 India revenue ₹1,40,302 करोड़ और EBITDA ₹34,272 करोड़ रहा, जिससे करीब 24% EBITDA margin बनता है। India crude steel production करीब 23.4 MT और deliveries लगभग 22.5 MT के record स्तर पर पहुंचीं।
इससे fundamentals में improvement का संकेत मिलता है, खासकर domestic operations में। लेकिन Tata Steel को केवल India business की तरह देखना सही नहीं होगा। European operations, steel realizations और raw-material costs consolidated profitability को प्रभावित कर सकते हैं।
Fundamental view: फिलहाल picture supportive लेकिन cyclical risks के साथ दिखाई देती है।
Technical Analysis (टेक्निकल विश्लेषण)
यह section आपके दिए हुए Daily, Weekly और Monthly TradingView screenshots पर आधारित है। इसलिए नीचे दिए technical levels current trading guarantee नहीं बल्कि chart-based levels to watch हैं।
Daily Chart
Daily chart में price लगभग ₹187.55 के आसपास दिखाई दे रहा है।
Stock May के लगभग ₹220+ zone से correction के बाद ₹185–₹190 area में consolidation करता दिख रहा है।
सबसे महत्वपूर्ण बात यह है कि Daily RSI 44.96 है। RSI 50 से नीचे होने के कारण momentum अभी पूरी तरह bullish नहीं कहा जा सकता।
लेकिन MACD में एक interesting development है। MACD line लगभग -1.63, signal line -2.71 और histogram करीब +1.09 दिख रहा है।
इसका मतलब short-term momentum में recovery attempt दिखाई दे रही है, लेकिन MACD lines अभी zero line से नीचे हैं। इसलिए इसे confirmed major trend reversal मानना जल्दबाजी होगी।
Daily Support
Chart structure के हिसाब से पहला महत्वपूर्ण zone करीब:₹184–₹185 इसके नीचे अगला visible support area लगभग: ₹180–₹182 हो सकता है। ₹184 के नीचे sustained breakdown होने पर short-term technical structure कमजोर हो सकता है।
Daily Resistance
ऊपर पहला resistance करीब: ₹190–₹194 का zone दिखाई देता है। इसके बाद ₹198–₹200 psychological और chart resistance area महत्वपूर्ण हो सकता है। ₹200 के ऊपर sustained move आने पर price structure में ज्यादा meaningful strength दिखाई दे सकती है।
Weekly Chart क्या बता रहा है?
Weekly chart short-term investors के लिए ज्यादा caution दिखा रहा है।
Weekly RSI 45.01 है, यानी momentum neutral से थोड़ा weak side पर है। Weekly MACD screenshot में: MACD: -0.92 Signal: 2.21 Histogram: -3.13 दिख रहा है। यह weekly timeframe पर bearish momentum को दर्शाता है।
May के ₹215–₹220 area से sharp correction के बाद stock ₹185–₹190 zone तक आ चुका है। इसलिए bulls के लिए केवल एक-दो positive sessions पर्याप्त नहीं होंगे।
Weekly structure बेहतर होने के लिए पहले ₹195–₹200 zone reclaim करना महत्वपूर्ण होगा। इसके बाद ₹205–₹211 area अगला बड़ा hurdle बन सकता है।
Monthly Chart: Long-Term Picture
तीनों charts में सबसे interesting picture monthly timeframe पर दिखाई देती है।
Monthly RSI 55.62 है, यानी RSI अभी 50 से ऊपर है। इससे long-term momentum पूरी तरह bearish नहीं दिखता।
Monthly MACD भी अभी positive territory में है: MACD: 14.40 Signal: 14.57 Histogram: -0.17 यहां caution यह है कि MACD line signal line से थोड़ा नीचे आ गई है और histogram marginally negative है।
इसलिए monthly chart का message broadly यह है: Long-term structure अभी पूरी तरह टूटा नहीं है, लेकिन momentum cool-off हो रहा है। यही daily/weekly और monthly charts के बीच सबसे बड़ा difference है।
महत्वपूर्ण Support और Resistance
| Level | Technical Importance |
|---|---|
| ₹180–₹184 | Major near-term support zone |
| ₹185–₹188 | Current consolidation area |
| ₹190–₹194 | Immediate resistance |
| ₹198–₹200 | Psychological/technical hurdle |
| ₹205–₹211 | Major resistance zone |
| ₹220–₹224 | Major upper supply / previous high zone |
ये levels screenshot के visible price structure से निकाले गए zones to watch हैं, precise trading calls नहीं।
₹194 के ऊपर sustained move strength दिखा सकता है, जबकि ₹184 के नीचे sustained weakness downside pressure बढ़ा सकती है।
2026 Price Target — Bull vs Bear
Bull Case (तेजी)
Bull case में सबसे पहले stock को ₹194 और फिर ₹200 के आसपास की resistance decisively reclaim करनी होगी। Fundamental side पर India volume growth supportive factor है। Q1 FY27 India production 11% YoY बढ़कर 5.82 MT रही।
Brokerages की expectations भी upside case को context देती हैं। 25 June 2026 का reported consensus target ₹225.17 था। May 2026 reports में Axis Direct ₹235, Prabhudas Lilladher ₹247, ICICI Direct ₹270 और IDBI Capital ₹229 targets के साथ listed थे। Motilal Oswal की 17 May 2026 research report में ₹250 का SoTP-based target दिया गया था। Brokerage ने domestic volume growth, steel-price recovery और capacity expansion को अपने outlook में शामिल किया था। ध्यान रहे कि brokerage target का मतलब यह नहीं है कि शेयर उस level तक जरूर पहुंचेगा।
Bear Case (मंदी)
Bear case में सबसे बड़ा technical concern weekly chart है। Weekly RSI 45 के करीब है और MACD bearish है। अगर ₹184–₹180 zone decisively टूटता है तो technical weakness बढ़ सकती है।
Fundamental side पर steel prices, Chinese exports और coking-coal/input costs risk factors हैं। इसके अलावा European operations की profitability Tata Steel के consolidated earnings के लिए महत्वपूर्ण बनी हुई है। इसलिए सिर्फ low price देखकर stock को automatically undervalued मानना उचित नहीं होगा।
Tata Steel Share Price Target Table
| Year | Target Range | Basis |
|---|---|---|
| 2026 | ₹225–₹270 | June consensus + May 2026 brokerage targets |
| 2027 | विश्वसनीय target उपलब्ध नहीं है | Current sourced reports से defensible calendar-2027 range उपलब्ध नहीं |
| 2030 | विश्वसनीय target उपलब्ध नहीं है | Long-term analyst target सत्यापित नहीं |
यहां ₹225–₹270 range कोई GJTalks prediction नहीं है। यह उपलब्ध analyst reports/consensus से निकला reference range है। उदाहरण के लिए 25 June का consensus ₹225.17 था, जबकि individual May reports ₹229 से ₹270 के बीच थे।
2030 के लिए बिना earnings, capacity, steel-price cycle और valuation assumptions बनाए कोई exact price देना speculative होगा, इसलिए काल्पनिक target नहीं दिया गया है।
Tata Steel में अब किन levels पर नजर रखें?
आपके तीनों charts को साथ रखकर picture काफी साफ बनती है।
Daily: recovery की कोशिश।
Weekly: अभी कमजोर।
Monthly: long-term trend पूरी तरह bearish नहीं, लेकिन momentum घटा है।
इसलिए ₹184–₹180 downside पर और ₹194–₹200 upside पर important decision zones बनते हैं।
अगर stock ₹200 के ऊपर sustain करता है तो ₹205–₹211 और बाद में ₹220–₹224 zones फिर focus में आ सकते हैं। इसके विपरीत ₹180 के नीचे sustained breakdown technical picture को ज्यादा कमजोर कर सकता है।
अक्सर पूछे जाने वाले सवाल (FAQ)
Tata Steel का 2026 target क्या है?
25 June 2026 के reported consensus में target ₹225.17 था। May 2026 की selected brokerage reports में ₹229–₹270 तक targets थे। इन्हें analyst estimates समझना चाहिए, guaranteed future prices नहीं।
क्या Tata Steel long term के लिए अच्छा है?
FY26 में EBITDA और PAT में improvement तथा India production growth positive factors हैं। दूसरी तरफ steel commodity cycle, European operations और raw-material costs बड़े risks हैं। इसलिए long-term case mixed factors पर निर्भर करता है।
Tata Steel share का support क्या है?
दिए गए charts के आधार पर ₹184–₹180 important near-term support zone दिखाई देता है। यह chart interpretation है, guaranteed reversal level नहीं।
Tata Steel share में क्या risk है?
Steel prices में गिरावट, China से exports, coking-coal costs, global slowdown, European operations की profitability और technical support breakdown प्रमुख risks हैं।
Tata Steel का 2030 target क्या हो सकता है?
विश्वसनीय 2030 analyst target उपलब्ध नहीं होने के कारण exact figure देना उचित नहीं है। इतने लंबे समय में capacity expansion, earnings, debt, commodity cycle और valuation multiples materially बदल सकते हैं।
स्रोत (Sources)
Tata Steel Ltd. — 15 May 2026: FY2025-26 official financial results/press release; consolidated revenue ₹2,32,140 crore, EBITDA ₹34,848 crore and PAT ₹10,886 crore.
Tata Steel Ltd. — 8 July 2026: Q1 FY27 provisional production and delivery update; India crude steel production 5.82 MT and deliveries 5.17 MT.
Trendlyne — 25 June 2026 data: Tata Steel analyst consensus ₹225.17 and individual brokerage targets.
Motilal Oswal Research / Moneycontrol — 17/20 May 2026: ₹250 SoTP-based target.
MarketWatch — 7 August 2026: Tata Steel close ₹188.00 and 52-week high ₹224.40.
User-provided TradingView charts: Daily, Weekly and Monthly Tata Steel charts used for RSI, MACD and support/resistance interpretation.
No comments yet. Be the first to share your thoughts.